Real Time Data and Statistics
Statistics with Padel iQ
Statistics with Padel iQ
Key features
Interactive Graphs
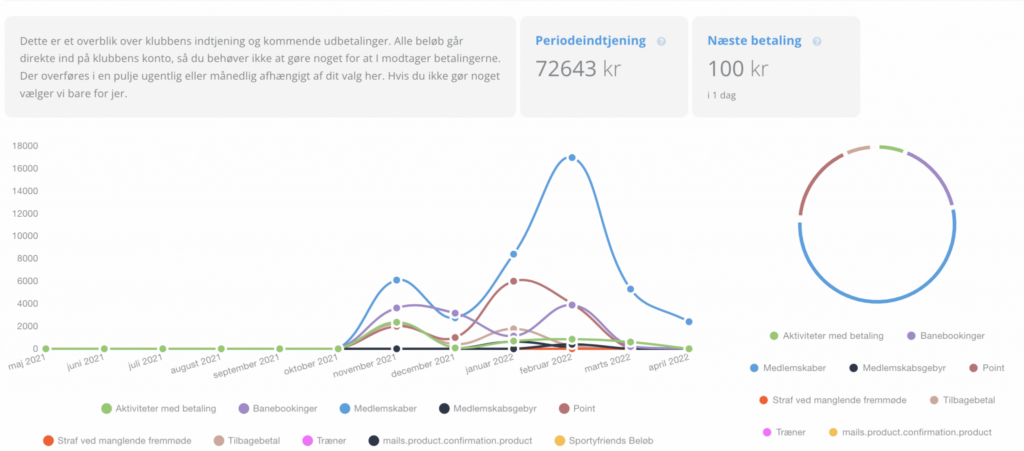
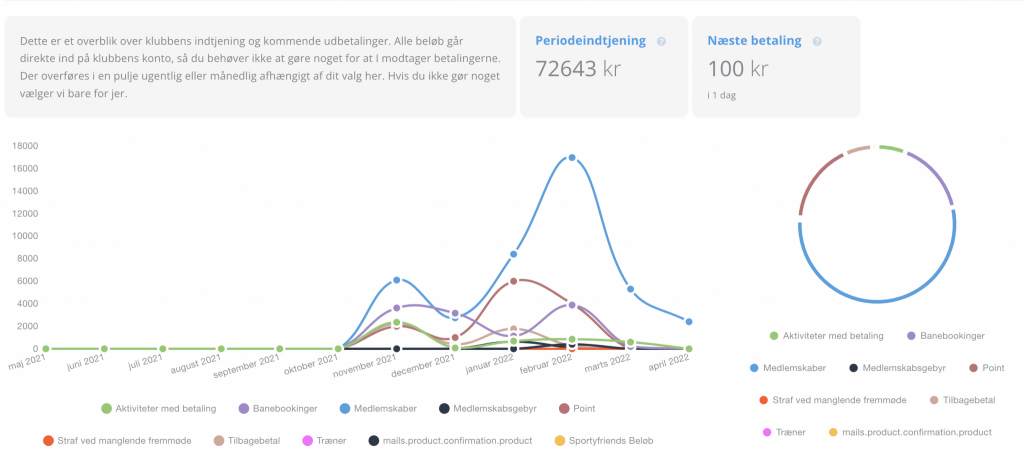
To ensure that graphs do more than offer a basic overview, Padel iQ presents the data of your club in intuitive, interactive graphs. With these graphs, you can not only select the timeframe from which you would like data to be displayed, but also select which data should be included or removed, and view specific data points. This ensures that you always have accurate and relevant data and statistics about the different sectors of your club or center.
Extensive Filtering Options
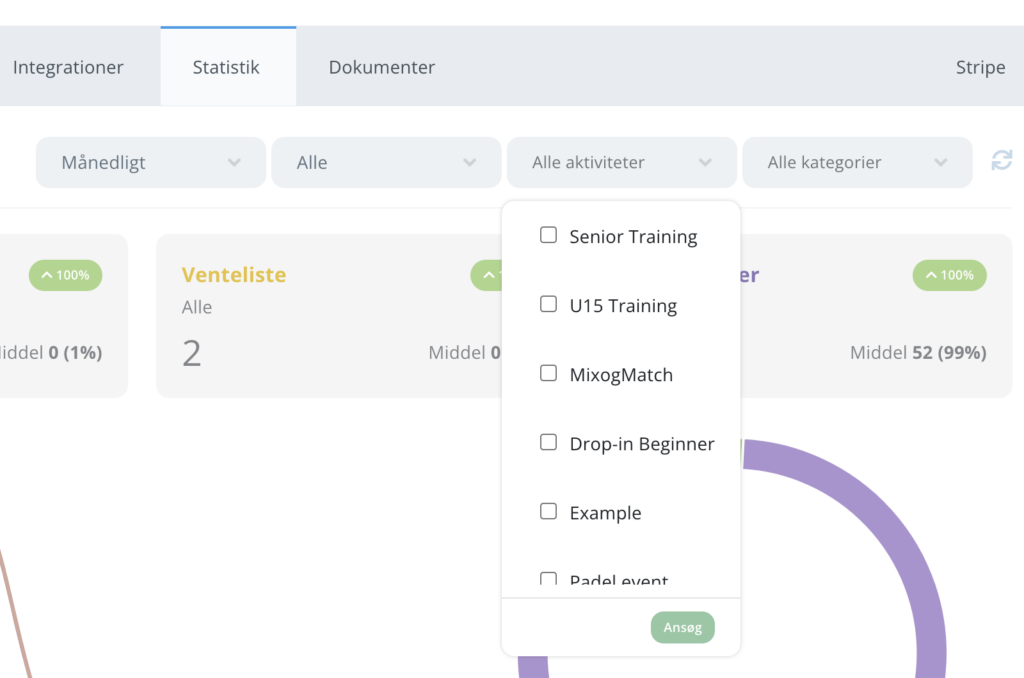
Sometimes, general statistics are not enough to give you the key insights you desire. This is why Padel iQ has developed extensive statistics filtering options, allowing you to view information about specific, demographics, events, dates and more. By using these filters, Padel iQ can help you understand the ins and outs our your club or center and offer the information you need to make impactful changes and improvements supported by data.

Key Performance Indicators
At the heart of statistics are key performance indicators (KPIs), which help you measure the performance of your club or center. Padel iQ’s statistics pages offer KPIs about memberships, bookings, activities, finance and survey data. Some examples can of KPIs with Padel iQ offers include the occupancy rate of courts and activities, the average value of a membership + member retention rate and member satisfaction levels.

Membership Statistics
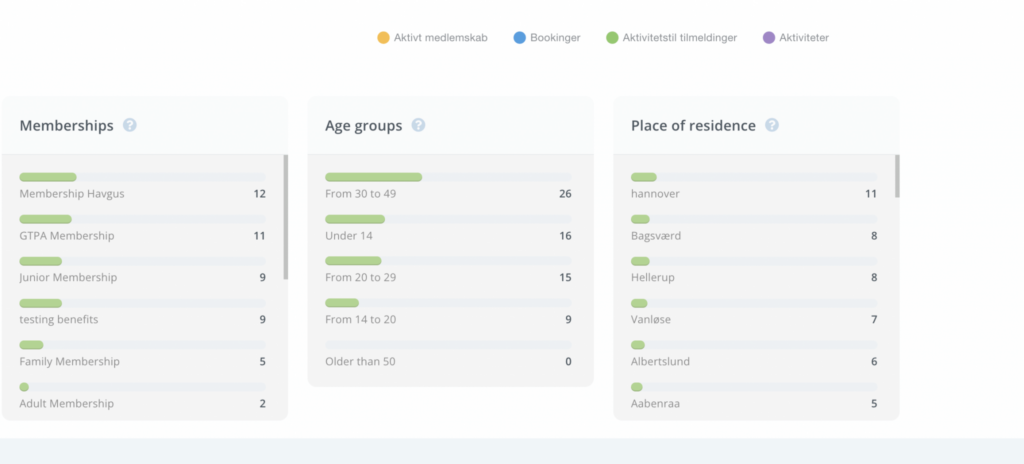
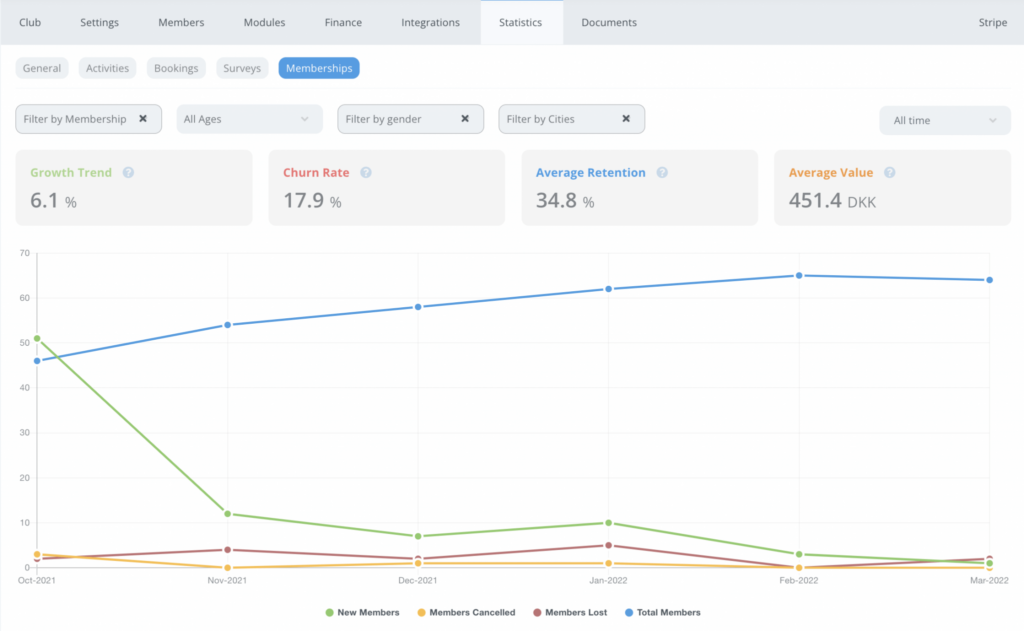
This module offers detailed statistics about the memberships and active members in your club or center.
We present the data collected to you in the form of key figures and graphs of memberships. The key figures show you, among other things:
- Growth Trend
- Churn Rate
- Retention Rate
- Average membership value
- Users joined/cancelled

Finance Statistics
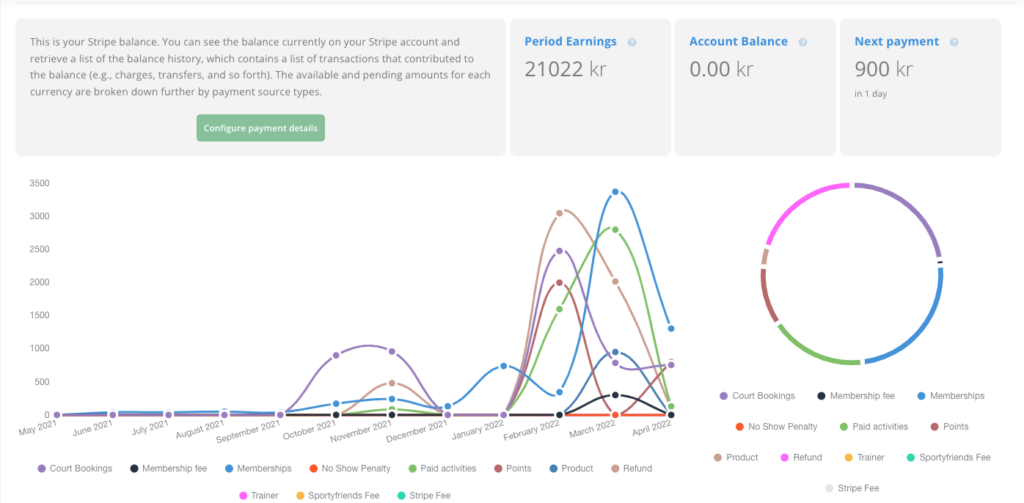
This module offers detailed statistics about the finances in your club or center. The aim is to give you a deeper insight into how users are applying your club’s resources.
We present the data collected to you in the form of key figures and graphs of finances. The key figures show you, among other things:
- Period Earning
- Account Balance
- Next Payments

Activity Statistics
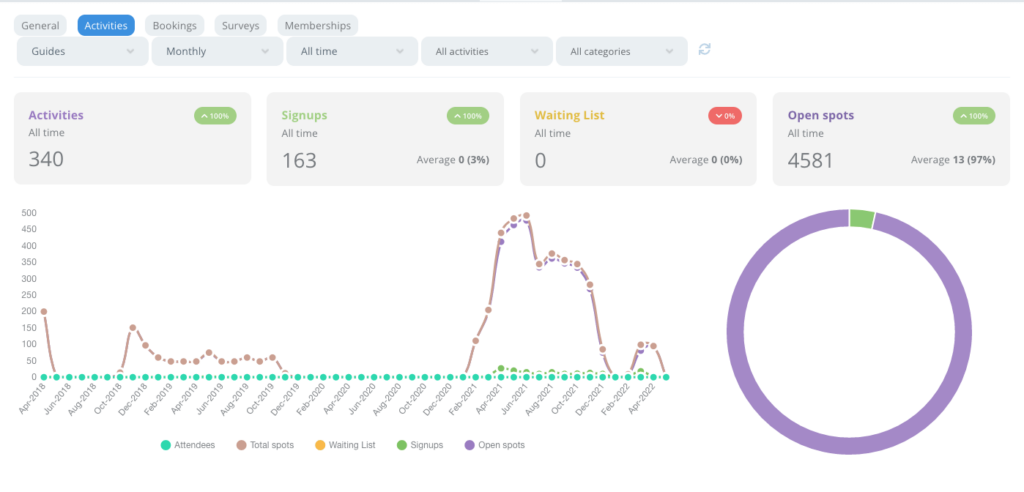
This module offers detailed statistics about the activities and events in your club or center.
We present the data collected to you in the form of key figures and graphs of acitivites. The key figures show you, among other things:
- Activties
- Signups
- Waiting List
- Open Spots
- Attendees
In addition, you can also view a series of graphs on which you can filter the data about the memberships in your club.

Interactive Graphs
To ensure that graphs do more than offer a basic overview, Padel iQ presents the data of your club in intuitive, interactive graphs. With these graphs, you can not only select the timeframe from which you would like data to be displayed, but also select which data should be included or removed, and view specific data points. This ensures that you always have accurate and relevant data and statistics about the different sectors of your club or center.

Extensive Filtering Options
Sometimes, general statistics are not enough to give you the key insights you desire. This is why Padel iQ has developed extensive statistics filtering options, allowing you to view information about specific, demographics, events, dates and more. By using these filters, Padel iQ can help you understand the ins and outs our your club or center and offer the information you need to make impactful changes and improvements supported by data.

Booking Statistics
Booking Statistics
Better business, Happier players
Don't just take our word for it, hear it from our customers.
Whether you want to discuss customer journeys, memberships, insights, automation, or marketing, we have the features that will improve your relationships with customers and make it easier for both trainers and administrators.




Ready to make your
work easier?
With this intuitive booking and membership
A large part of padel courts and booking systems have been built with haste and with a short term focus.
Padel iQ is the World’s new booking platform, designed and based in Copenhagen, for padel only and is here to secure an even more professional approach globally to the future when it comes to the customer experience and additional revenue. We achieve this by addressing member, booking and event management in an intuitive and easy to use system.

